STATISTICS PRODUCTS

DOWNLOADS:

First 100 lags

DESCRIPTION

The autocorrelation function (ACF) was computed for the first 150 lags using the MODIS NDVI time series from 2001 to 2012 obtained from the product MOD09Q1. The use of this ACF is highly useful to assess the temporal patterns of vegetation over agricultural or forested areas.

NDVI 250
TS 2000 - 2012
FILTERED
TS
ACF

Copyright: Creative Commons Attribution 4.0 International

DOWNLOADS:


DESCRIPTION:

We proposed a new methodology based on NDVI time series autocorrelation values and machine learning algorithms to assess fallowing temporal patterns across rainfed agricultural areas that was tested in mainland Spain. We found that approximately half of rainfed agricultural areas were regularly cultivated (RC) and distributed mainly in the north- western Spain whereas lands with crop-fallow rotation patterns every two (CF-2) and three years (CF-3) were distributed across northeast, center and south of Spain. You can see the spatial distribution in the map viewer below

MOD
09Q1
NDVI 250
TS 2000 - 2012
FILTERED
TS
ACF
SPECIFIC ACF

Copyright: Creative Commons Attribution 4.0 International

DOWNLOADS

Raster Image


DESCRIPTION:

In this work, we describe vegetation oscillations by a novel quantitative approach based on the spectral analysis of Normalized Difference Vegetation Index (NDVI) time series. A new set of global periodicity indicators permitted to identify different seasonal patterns regarding the intra-annual cycles (the number, amplitude, and stability) and to evaluate the existence of pluri-annual cycles, even in those regions with noisy or low NDVI. Most of vegetated land surface (93.18%) showed one intra-annual cycle whereas double and triple cycles were found in 5.58% of the land surface, mainly in tropical and arid regions along with agricultural areas. In only 1.24% of the pixels, the seasonality was not statistically significant. The highest values of amplitude and stability were found at high latitudes in the northern hemisphere whereas lowest values corresponded to tropical and arid regions, with the latter showing more pluri-annual cycles. The indicator maps compiled in this work provide highly relevant and practical information to advance in assessing global vegetation dynamics in the context of global change.

MOD
09Q1
NDVI 250
TS 2000 - 2012
FILTERED
TS
ACF
SPECIFIC ACF

Copyright: Creative Commons Attribution 4.0 International

DOWNLOADS:

Specific lags


DESCRIPTION:

The specific autocorrelation coefficients were generated using the MODIS NDVI time series from 2001 to 2012 obtained from the product MOD09Q1. From the NDVI autocorrelation function using MOD09Q1 product can be derived some relevant autocorrelation coefficients for vegetation dynamics assessment. The identification of these AC values depends on the temporal frequency of satellite images. When using MOD09Q1 MODIS product which consists of 8-day composites, the annual temporal dependency is measured by the AC value at lag 46. Thus, the most important lags to assess the temporal patterns of vegetation are the AC values 
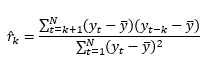
at lags 1, 23, 46, 92 and 138 which measures the temporal dependency of NDVI at 8 days, 6-months, one, two and three years respectively. Each autocorrelation (AC) coefficient is calculated according to the following equation:

MOD
09Q1
NDVI 250
TS 2000 - 2012
FILTERED
TS
ACF
SPECIFIC ACF

Copyright: Creative Commons Attribution 4.0 International

DOWNLOADS:

>


DESCRIPTION:

would be interesting to analyse the seasonal patterns of vegetation of the periodogram ordinates at one year, 6 months and 4 months. The relevancy of seasonal patterns could be evaluated by yhe Fisher Kapa test
This Kappa test is calculated:

MOD
09Q1
VHRR-NDVI
TS
PERIODOGRAM
AVHRR-NDVI
ACF

Copyright: Creative Commons Attribution 4.0 International